Social Media Analytics for Business
As with any marketing endeavor, metrics are imperative for success. When it comes to social media for business, there are great free tools available for each of the major social networks. Here, we will take a high-level look at each of these analytical tools.
Facebook Insights
When you log into your Business Facebook page, there is a tab in the upper left-hand corner titled “Insights.” This is where you can look at the metrics for your page.
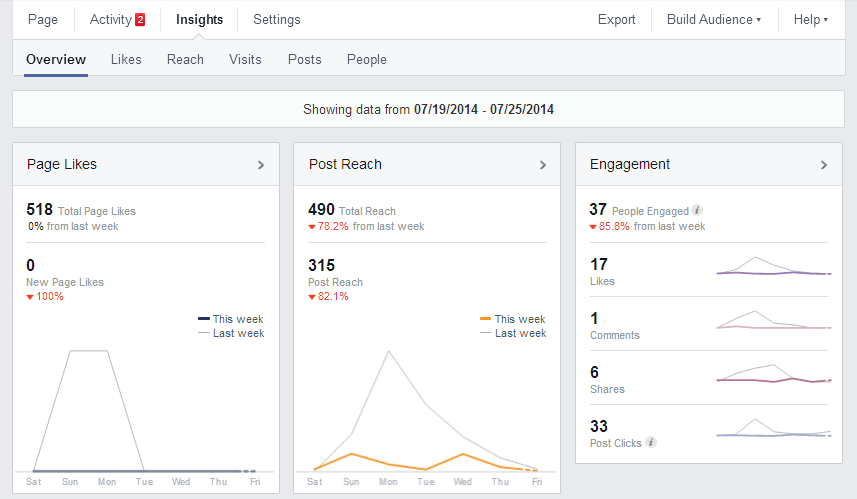
In addition to listing your post activity for the past 90 days (not pictured here), the Overview screen provides a high-level report of your Facebook Page and Posts for a one week period. You can dig down into each of the metrics by clicking on the related tab.
You can quickly see how many “Likes” your Page has and how this has fluctuated up or down over the week. You can also see how many users have seen your posts by looking at “Post Reach.” Lastly, you can see what type of Engagement your posts are receiving, which is even broken down into Likes, Comments, Shares, and Post Clicks. Likes and Post Clicks are great metrics for determining if people like your content. Use these metrics to determine what types of content your audience wants to see in the future.
Google Insights
The insights for your Google+ Business Page can be accessed by logging into your Google+ Business Page. Once you are logged into your Page, go to the upper right-hand corner and click on the Business Apps icon. It looks like a Rubik’s cube and is the left of the little Bell (Notifications) icon. Select “Insights” from the drop-down menu.
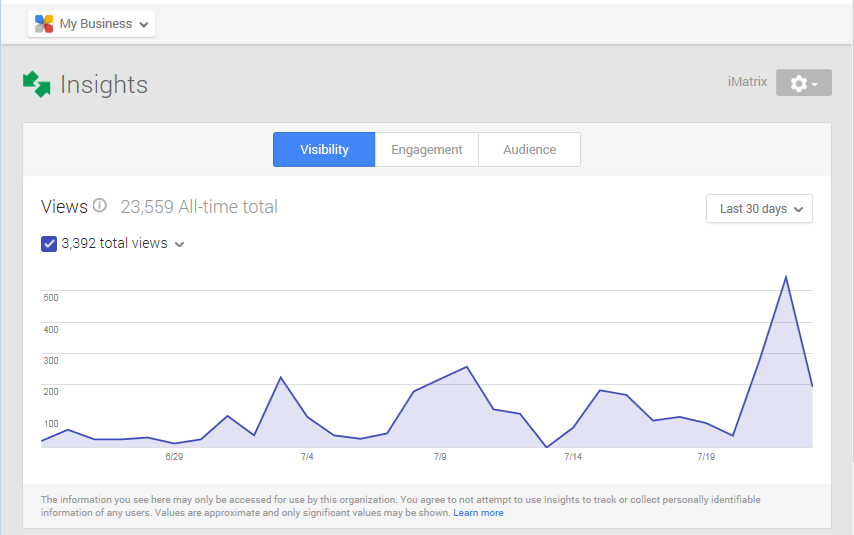
In Google+ Insights, the first screen is the Visibility screen which provides a snapshot of how many people have viewed your posts, profile, and photos. If you click on the arrow next to “Total Views,” it will break down this total number by type.
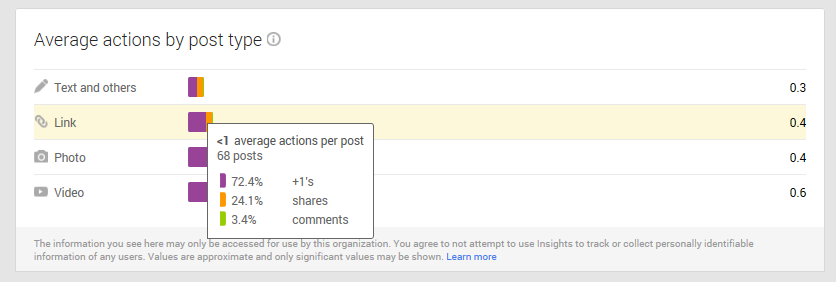
The real information in Google+ Insights is in the “Engagement” section. Click on the tab and scroll down the page to see the engagement for each post. The best information is in the “Average actions by post type” table at the very bottom. The bar graph tells you what types of posts are most popular. In the example above, text-only posts get the least engagement and video gets the most engagement. This particular Business has the best success posting videos to their page.
Twitter Analytics
Analytics on Twitter are tricky. When a business owner logs into her Business Twitter account, all that is available is Notifications and Mentions. However, Twitter Analytics are available for businesses that either have Twitter Cards or Advertise on Twitter. A free, easy to use social listening tool is TweetDeck.
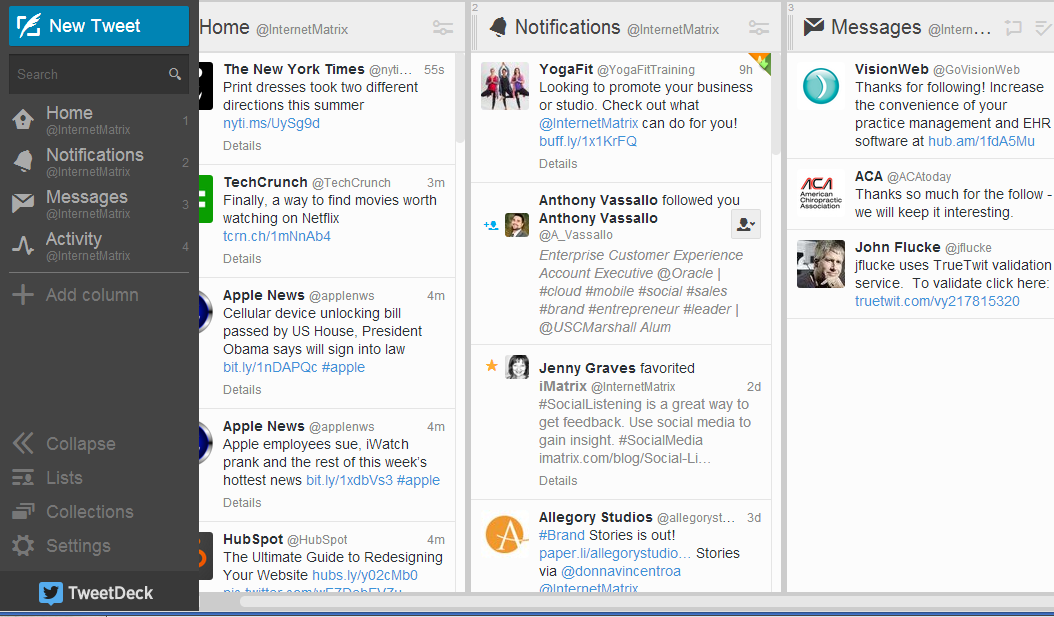
TweetDeck is great because you can review analytics (Mentions, Notifications, Activity, etc.) AND you can schedule any tweets that you want to go out. All you need to do is go to http://www.tweetdeck.twitter.com and sign up your Business’ Twitter Account. It will automatically pull in current analytics for your account.
Tracking analytics for various social networks can take a lot of time. Don’t get overwhelmed, get help from professionals! Call 1-800-462-8749 for a free social media consultation from an Internet Consultant.
(function() {
var po = document.createElement(‘script’); po.type = ‘text/javascript’; po.async = true;
po.src = ‘https://apis.google.com/js/platform.js’;
var s = document.getElementsByTagName(‘script’)[0]; s.parentNode.insertBefore(po, s);
})();