How to Navigate Facebook Insights
Social media offers an excellent way for businesses to get to know and engage with their audiences. Facebook is a favorite of web users and brands alike, boasting over 2 billion active monthly users and hosting approximately 70 million businesses.
Facebook allows you to post content, engage with your clients, receive reviews, and attract new business all from a cost-effective, user-friendly interface. Well, as long as you know how to best reach your ideal follower.
One of the best ways to learn how to appeal to your target audience is to use the network’s analytics tool, Facebook Insights. This tool allows you to assess your social media marketing success by gathering information about your page’s performance and organizing it into a variety of data tables.
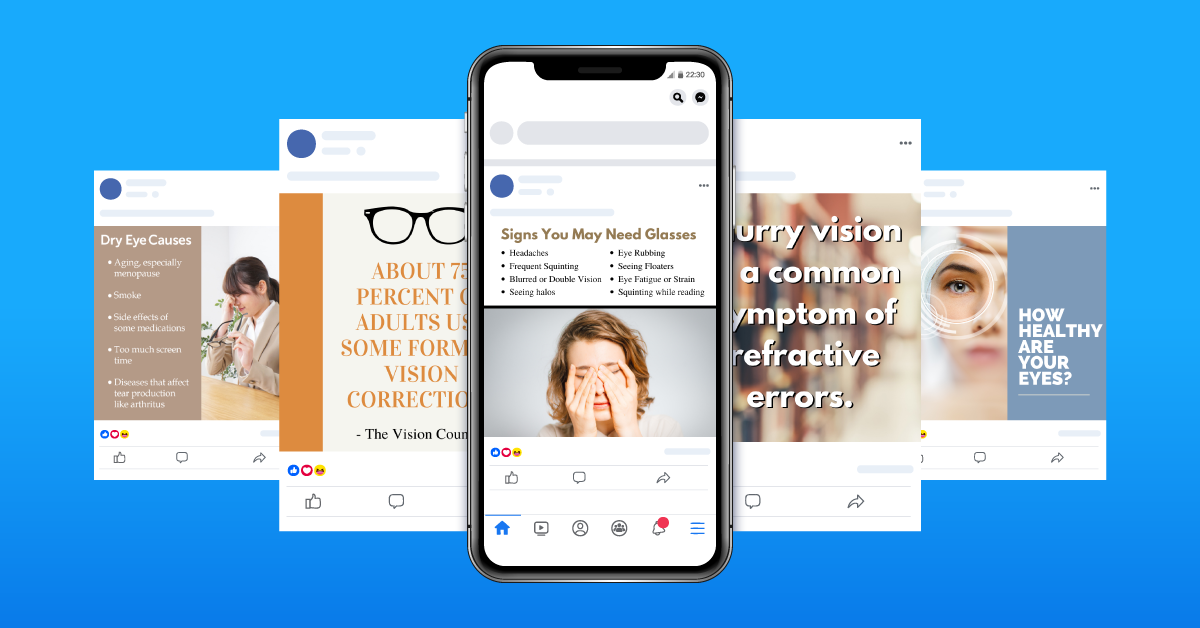
By routinely viewing and analyzing the data collected by Facebook Insights, you can discern which kind of content best engages your audience and which are the ghosts of posts past.
Are you new to the Facebook Insights tool or are you looking to brush up on your basics? In this post, we’ll cover what you need to know to navigate Facebook Insights and gain perspective on your page’s overall health.
Your Facebook Insights Dashboard
Facebook’s Insight dashboard neatly organizes your page’s data into specific categories that enable you to get a deeper understanding of how your audience is interacting with your page. We’re going to go over each of the most important features in your dashboard and what these insights mean to you.
Overview
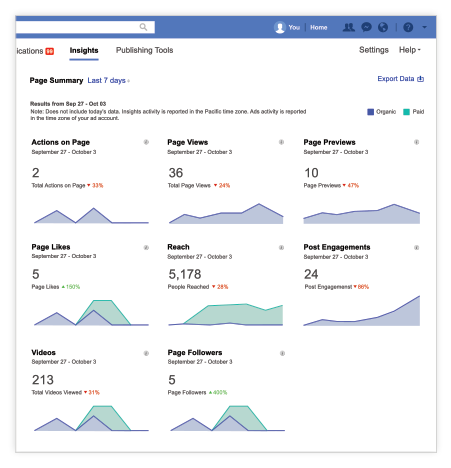 After logging into your Facebook business page, click on the “Insights” tab at the top of your screen. This will automatically take you to the Overview tab where you will be able to view a compiled summary of your page’s performance over a certain period of time. To adjust the time period you wish to view, simply click the drop down menu after the bolded words “Page Summary”.
The overview consists of the data that Facebook has deemed most important, from page views to post engagements. If you want a more in-depth look at a table, click on the table or use the navigation menu to the left of your summary. This will open an interactive display of data that details each component of that subsection.
Insight’s overview is meant to provide a cumulative report of your page’s performance. While it’s a great way to check in on your page, a closer look at each item on the list can provide more information about how to better reach your audience.
Overview Tables
Here’s a quick look at what each of the sections on your overview tab tell you about your page’s performance.
- Actions on Page – The number of clicks on your contact information or call-to-action button.
- Page Views – The number of times your page has been viewed. This includes Facebook user and non-Facebook user views.
- Page Previews – The number of times people have previewed your page by hovering above your name or profile picture.
- Page Likes – The number of new page likes you have earned over a given time period organized by unpaid and paid likes.
- Page Reach – The number of people who had your post appear on their feed or screen.
- Recommendations – The number of times people have recommended your page to others.
- Post Engagement – The overall number of times people have engaged with your posts, including likes, shares, comments, etc.
- Page Responsiveness – These percentages are determined by how often you respond to messages and the timeliness at which you do so.
- Video – The number of views your videos have been watched for a minimum of three seconds.
- Page Follows – The number of new followers your page has acquired in a given time period.
Likes
Click on “Page Likes” in the menu panel at the left-hand side of your the Insights page. Here you’ll find more detailed information about your page likes. You can set specific time frames so that you can analyze your data from the past week, month, or a unique time frame.
This is broken down into three categories:
- Total Likes – The total likes over the time period selected.
- Net Likes – The total number of new likes excluding any subsequent unlikes.
- Where Your Page Likes Happened – This distinguishes where each like originated, such as from your page, a search, or paid ads.
Reach
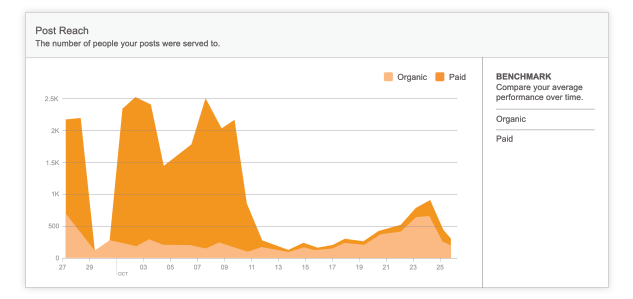 Just below “Likes”, you’ll see “Reach”. These graphs outline how many people your content has reached over a certain amount of time. Notice that you can hover over the graphs to see the data for specific days.
The data listed includes:
- Post Reach – The number of people shown your posts organized by organic and paid search.
- Recommendations – How many times people have recommended your page to others.
- Reactions, Comments, Shares, and More – The amount of engagement your posts have received. A high score in this category will help more people see your posts.
- Reactions – Documents the various reactions people have had to your content.
- Hide, Report as Spam, and Unlikes – Reports negative engagement with your posts. A high score in this section will decrease the amount of people who see your posts.
- Total Reach – The number of people who saw any kind of activity from your page.
Actions on Page
This set of data summarizes the actions that were taken on your page to interact with your business. Several of the graphs here allow you to view the data based on total, age and gender, country, city, and device on which the action was taken.
These graphs feature:
- Total Actions on Page – This breaks down the click by type, including clicks on your website, directions, and phone number.
- People Who Clicked Action Button – This is a section in which you can view more specific details about who clicked on action buttons. The following three also break down particular demographics.
- People Who Clicked Get Directions
- People Who Clicked Phone Number
- People Who Clicked Website
Posts
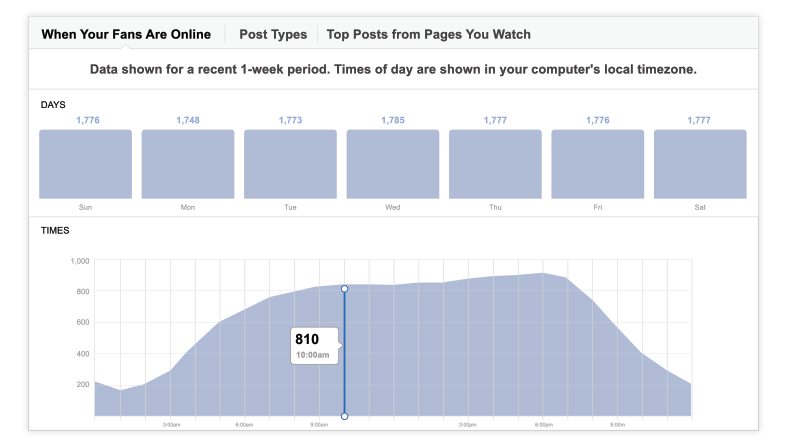 The Posts section provides an in-depth look at pertinent information that can affect engagement with your content. This data enables you to analyze which kind of posts perform best, what time your audience is most likely to engage with them, and how your competitor’s posts are doing.
This data set shows you…
- When Your Fans Are Online – This documents the most popular times that your page receives interaction.
- Post Types – These bar graphs rank how each type of post is performing.
- Top Posts From Pages You Watch – This section gives you insight into how your competitors are reaching your audience.
Why Use Facebook Insights
Facebook Insights gives you the data you need to analyze your page’s performance and shows you what kind of content your audience wants to see. By gathering information about the most successful posts, you can determine how to adjust your social media marketing plan going forward.
Looking for more resources to help you learn how to reach your business goals?
Check out these articles!
How to Build Your Business’s Facebook Profile
How to Tell a Story Through Content Marketing
What We Can Learn From the Best Twitter Accounts
PGNlbnRlcj48ZGl2IGRhdGEtaWQ9Ijk4ZGQ2MWYzOGQiIGNsYXNzPSJsaXZlY2hhdF9idXR0b24iIG9uY2xpY2s9InBhcmVudC5MQ19BUEkub3Blbl9jaGF0X3dpbmRvdyh7c291cmNlOidtaW5pbWl6ZWQnfSk7IHJldHVybiBmYWxzZSI+PGEgaHJlZj0iIyI+PGltZyBzcmM9Imh0dHBzOi8vaW1hdHJpeC5jb20vd3AtY29udGVudC91cGxvYWRzLzIwMTgvMDUvbGl2ZS1jaGF0LWJsb2ctMS5qcGciIGFsdD0iaU1hdHJpeCBMaXZlQ2hhdCIgd2lkdGg9IjgwMHB4IiBoZWlnaHQ9IjIyNXB4IiBib3JkZXI9IjAiPjwvYT48L2Rpdj48L2NlbnRlcj4=